

Company News
Randox unveils Advanced Statistics with Acusera 24.7
The only thing that sounds more terrifying than statistics, is advanced statistics. For many of us, the dread associated with having to carry out complex calculations can be too much to bear. For others, statistics are not just a set of numbers; they’re a captivating puzzle waiting to be solved. The allure of dissecting intricate patterns, unravelling hidden relationships, and drawing meaningful conclusions makes these statistical enthusiasts embrace the challenges of advanced statistics with excitement rather than apprehension.

No matter which camp you’re in, we bet you’re going to love the advanced statistics features included in Acusera 24.7. From Uncertainty of Measurement to Sigma Metrics, we’ve got you covered. Let’s explore these features and how we can make your statistical analysis easier than ever before.
Measurement uncertainty
If you’re involved in laboratory quality control, you’ll have heard all about measurement uncertainty (MU). To some it’s intuitive. To some it’s a labyrinth. MU is defined as a parameter associated with the result of a measurement that characterises the dispersion of values that could reasonably be attributed to the measured quantity. For example, if we say the pencil below measures 16cm ± 1cm, at the 95% confidence level we are really saying that we are 95% sure that the pencil measures between 15cm and 17cm.
In other words, the calculation of MU gives medical laboratories an estimate of the overall variability in the values they report. This is important for 3 reasons:
- It helps ensure the measured results are useful and not wildly inaccurate.
- It permits meaningful comparison of medical decision limits and previous results of the same kind in the same individual.
- It’s a regulatory requirement – ISO 15189:2022
All measurements involve some degree of inherent variability due to factors such as instrument limitations, environmental conditions, and biological variation. MU aims to quantify the doubt or range of possible values around the measurement result, helping to provide an understanding of the reliability and limitations of measurements. To complete this task comprehensively, the entire measurement process must be examined and should consider components such as systematic errors, random errors and uncertainties related to calibration, equipment, and the environment.
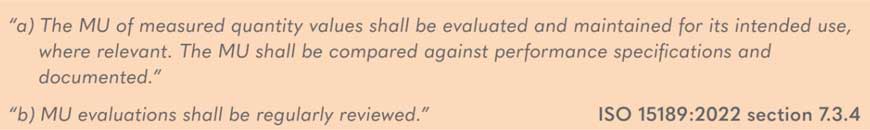
ISO 15189:2022 states:
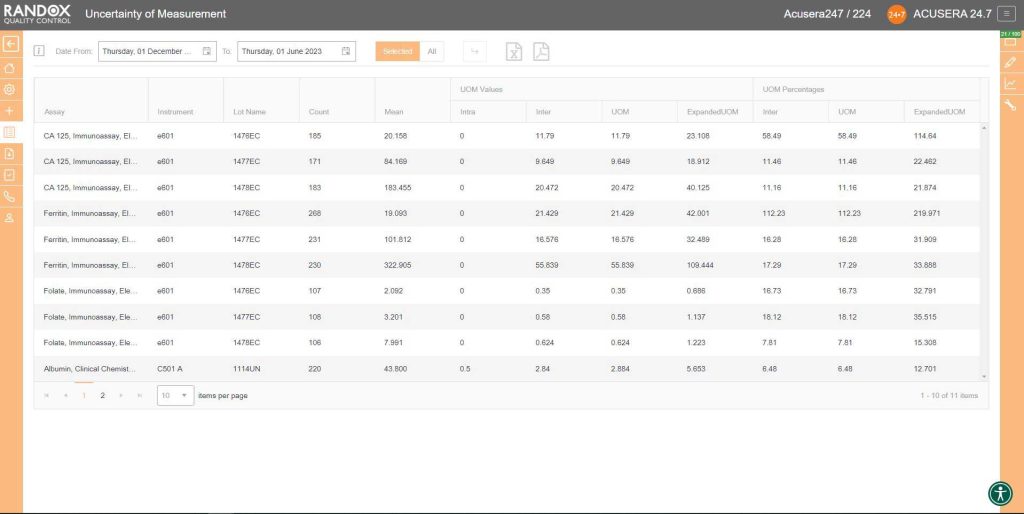
So, if you are seeking ISO15189 accreditation, there’s no avoiding MU and advanced statistics. Lucky for you, Acusera 24.7 can calculate MU and provide you with a report which you can export to Excel or PDF for auditing or archiving.
By liberating you from the need to manually calculate MU for all your assays and control levels, Acusera 24.7 streamlines the statistical analysis process, freeing you up to complete your other essential duties. It also helps reduce the chance of errors in the calculation; after all, no matter how talented you are at mathematics, we all make mistakes. The real-time nature of this kind of monitoring means you don’t have to recalculate every time you get more data – simply press the refresh button and you’ll automatically get a new MU report.
By incorporating automated tools to calculate MU, you gain the ability to proactively pinpoint and rectify potential error sources, mitigating the risk of inaccurate measurements and the repercussions that may follow.
Sigma metrics
The Sigma model was originally developed for the manufacturing industry as a method of process improvement focusing on minimising errors in process outputs. It has since been adopted by the medical laboratory to improve result reporting.
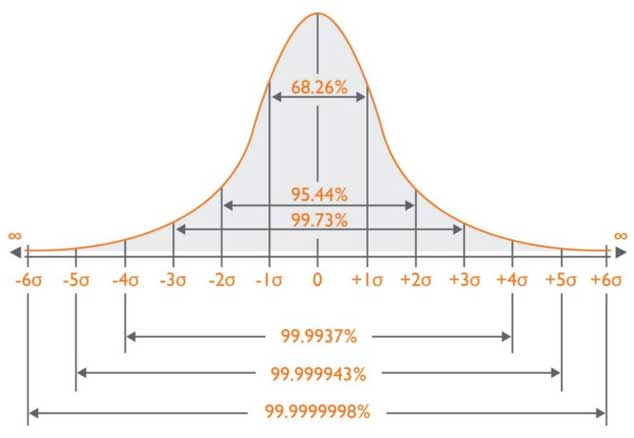
This model calculates the number of standard deviations or ‘Sigmas’ that fit within the quality specifications of the process – as the sources of error or variation are removed, the standard deviation becomes smaller, and the sigma score increases – 6 being the target. A 6 Sigma process can be expected to produce 3.4 defects, or false results, per million.
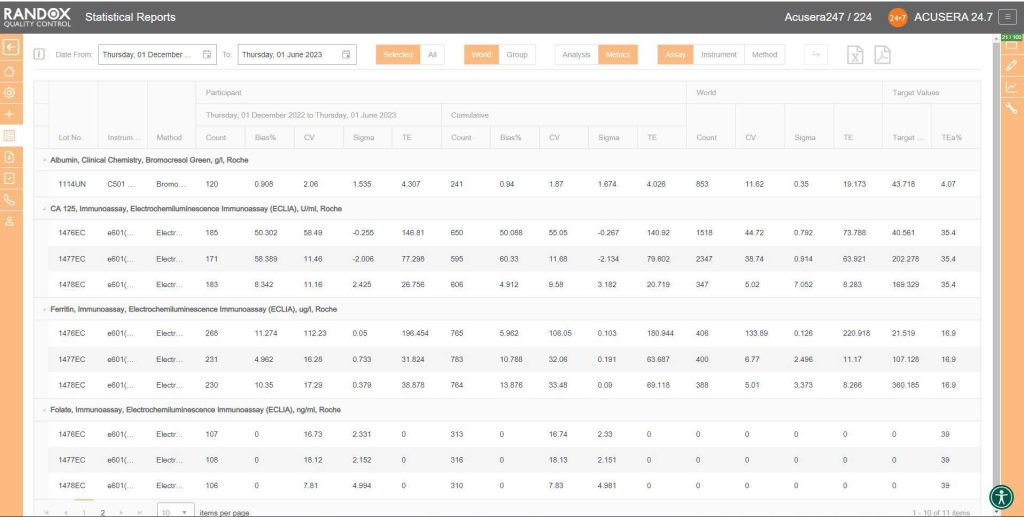
Using your predetermined performance limits, including biological variation (standard), RiliBÄK and CLIA, as the total allowable error (TEa), Acusera 24.7 can calculate a Sigma Score for a particular assay, method, or instrument, saving you the hassle of calculating this manually – freeing you up to investigate the sources of error and make improvements to your process.
This is displayed in our Statistical Metrics report along with Count, Bias%, and CV for your chosen range, your cumulative results and those from other Acusera 24.7 users from around the world to provide straightforward and comprehensive statistical analysis and peer group comparison.
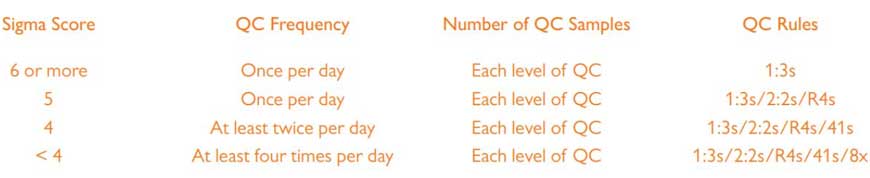
Once you’ve found out your Sigma Score for an assay, you can use this to determine your QC frequency and the multi-rules you should apply to your QC. The higher your Sigma Score, the less multi-rules you need to apply to your analysis and the less often you need to run QC for that assay. The table below shows the multi-rules and QC frequencies associated with each Sigma Score.
Acusera 24.7 includes multi-rule capabilities that can be utilised to monitor your QC data and index it as accepted, rejected, or trigger an alert, depending on the pre-defined multi-rules against which you want to check your data. These features enable the identification of nonconformities and reduce the need for laborious manual statistical analysis while enhancing the accuracy and precision of the laboratory. To read more about the multi-rule features of Acusera 24.7, take a look at our educational guide – Understanding QC Multi-rules.

Now that we’ve found which of our assays are underperforming, we can begin to take corrective action. The Sigma Score is affected by bias and imprecision of laboratory results, therefore improving these values will increase the Sigma Score. Some of the steps a laboratory can take are:
- Improved staff training
- Instrument maintenance
- Frequent calibration
- Strict adherence to SOPs when preparing controls and calibrators.
If you are still in the dark ages, carrying out your statistical calculations and analysis manually, reach out to us today to learn more about the time and expense we can help you save. Every day, more people are discovering the power of Acusera 24.7 and the benefits it has in their laboratory.
MB Bureau