

Company News
Acusera 24.7: Randox unveils QC data management software
What if we told you we had a solution to the multitude of monotonous hours spent analysing reams of IQC data and could provide you with an intuitive tool packed with comprehensive and customisable reports, interactive charts, and automated statistical analysis to help improve your QC data management?

Perhaps it sounds too good to be true?
This time, it isn’t.
Uncertainty of Measurement. 6Sigma. QC Multi-rules. These words can strike fear into the hearts of even the most experienced laboratory staff.
With Acusera 24.7, we’ve reached under the bed and forced the monster that is advanced statistical analysis out into the cold.
Acusera 24.7 is a live, cloud-based, interlaboratory QC data management and peer group comparison software.
A mouthful. I know.
But let’s break it down.
A live, cloud-based software means you can access your QC data from anywhere, anytime.
Bid farewell to the labyrinth of folders you hunt through when troubleshooting or looking for a specific dataset.
Interlaboratory management describes the momentous task many QC managers face – monitoring the QC performance of multiple laboratories in different locations, ensuring they all maintain the high standards required for accreditation and accurate patient results.
Unlike some big-name subscription services, we encourage you to use our software at different locations to help you monitor all your laboratories and instruments to see how their results stack up against one another.
Acusera 24.7 provides multiple levels of access which are completely customisable. This allows you to grant or restrict access to different parts of the software depending on what is required by your staff. This also allows QC managers to view data from all their sites in one location without needing multiple email chains from each laboratory.
“24.7 is an invaluable tool to maintain control over 13 sites with multiple platforms and I can’t stress enough how easy it is.”
Peer group comparison? Isn’t that what EQA is for?
Well, you would be right.
Yes, EQA does provide a comparison with your peer group, but it doesn’t have exclusive rights.
There are many benefits to comparing your IQC data with your peer group. The real-time comparison data aids with troubleshooting, or you can show off how great you are to your friends and colleagues.
You can select your peer group for an instrument, method and more, providing you with a comprehensive picture of how your laboratory performance compares to your peers using the same lot of control.
There are no submission deadlines. One less thing for you to worry about.
Still think it sounds too good to be true?
Then let’s look at some of the software features and how they can be used to make your daily QC data management easier.
Charts
For many laboratories, review of their QC data is a momentous task involving an abundance of printouts with different data tables and graphs and hastily scribbled notes going back maybe months, if not years.
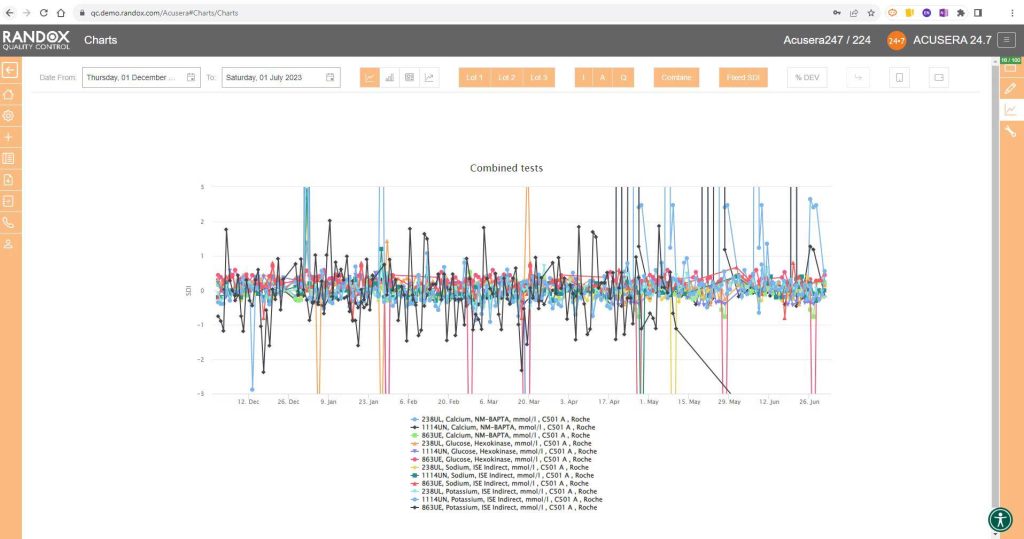
With Acusera 24.7’s interactive Levey-Jennings charts, you can see the QC data from a specified date range. This helps visualise trends and biases over any period to simplify the troubleshooting and lot validation processes, or, can be used as evidence during accreditation assessments. These charts can be generated for a single analyte or for multiple analytes and QC levels.
You can also add events to the graph to record factors that might impact the performance of your analyser such as preventive maintenance, calibrations or switching QC lots. So, when you come to review the QC data and see a shift in the results, you can see at a glance if there was an explanation for the change in QC results.
What’s more, the points plotted on the chart will appear in orange or red if they trigger your alert or reject protocols respectively. Those that appear as a triangle indicate a comment is attached. Comments can be added to any data point directly on the Levey-Jennings chart, allowing you to record any information relevant to the data, saving you time, not to mention the cost of all those sticky notes.
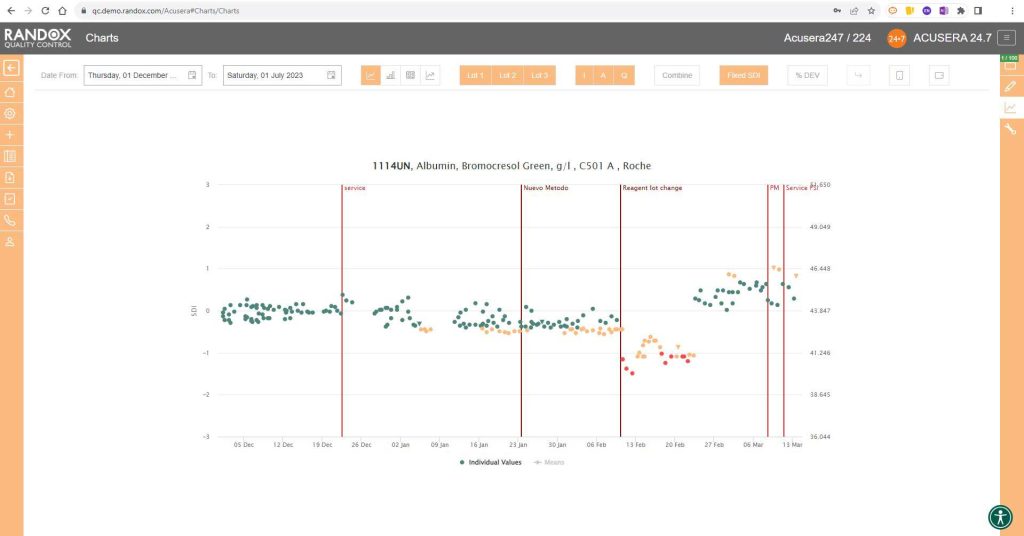
This complements the Panel feature of the software. Within Acusera 24.7 you can create a panel of tests, for example, a Liver Function Test panel, grouping all the tests together. You can then view all the QC data for this panel at the click of a few buttons. Shown below is the collective data for a clinical chemistry panel.
When you do need the paper copy, all the charts and reports found in Acusera 24.7 can be exported to Excel or PDF for independent analysis or printing, making it easy to bring your data to meetings or for hardcopy filing and audits.
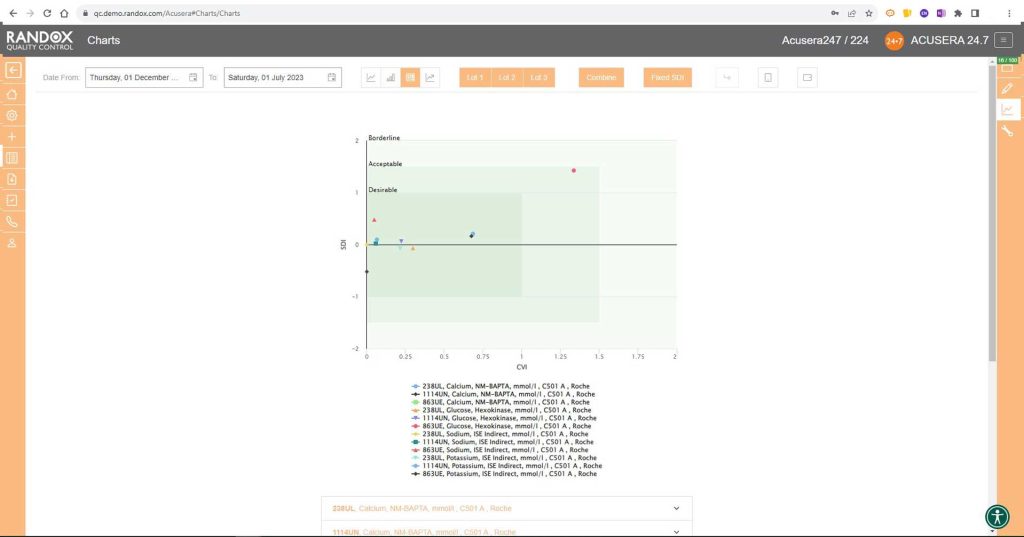
For peer group comparison, you can get a performance summary chart. This chart basically does the analysis for you! You define the date and time range, and the software looks at all the data points within it for you and your peer group, comparing individual data, means, CVs and SDs. Like our other charts, you can combine any number of these for multi-analyte analysis.
Advanced statistics
Some people love statistics. Others can think of nothing worse.
Either way, there’s a lot of work involved in advanced statistical analysis.
Even if you’re in the love camp, you might find yourself sickened before you’ve finished this metaphorical jar of marmite.
The role of a pathology laboratory is not to run QC and show off their statistical skills, but to provide accurate and appropriate patient results.
As the old saying goes, time is money.
But in your case, time is the difference between a fast or delayed diagnosis for a patient.
This may impact their condition or treatment.
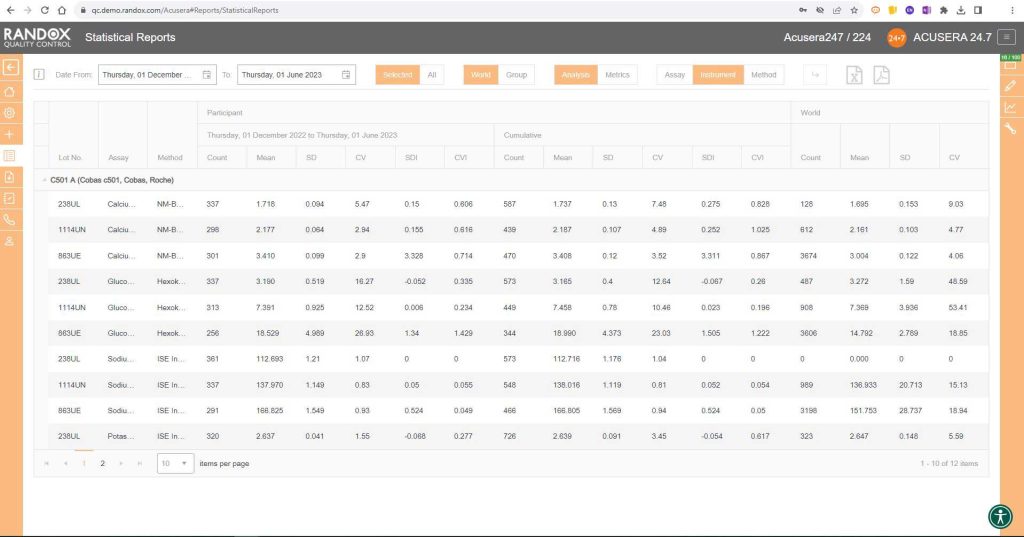
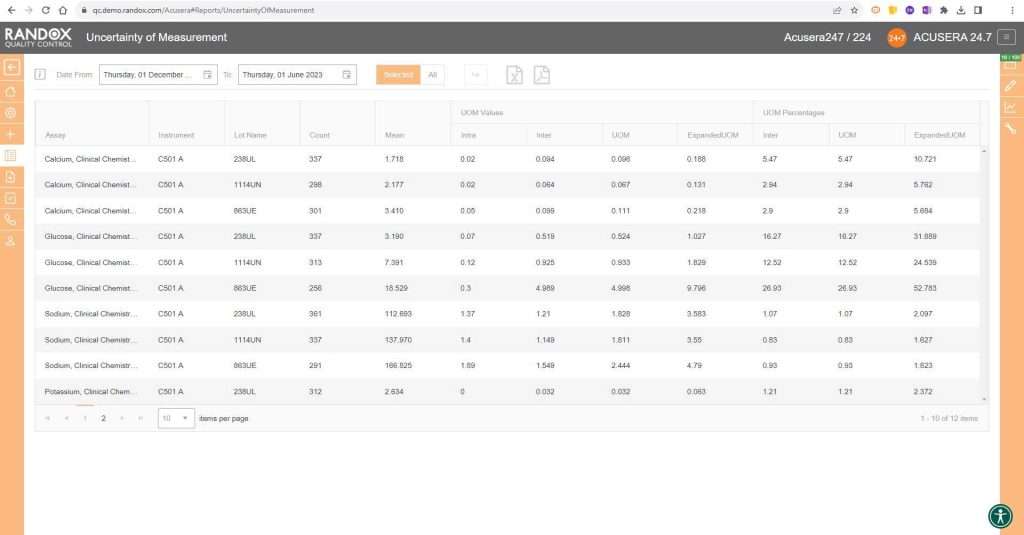
By making use of the suite of statistical options included in Acusera 24.7, including QC Multi-rules, 6Sigma and Uncertainty of Measurement, you can focus on providing the most accurate and efficient testing for patients.
Data entry
To save even more time, Acusera 24.7 can be integrated with many LIMS or Middleware packages for fully automated data transfer. At a predefined time, your internal software will send your QC data to a shared folder on your network and from there to a Randox Cloud IP address, meaning we don’t go into your IT system and take anything; we won’t cause any information security problems. This data is then taken from the cloud and populated onto 24.7.
All this in less time than it takes you to say, ‘fully automated data transfer.’
You can also import your data through a semi-automated upload procedure. For this, the data is exported from your LIMS or middleware and imported manually to your Acusera 24.7 account using an EDI import file. Simply put, all you have to do is send the file, and the software will populate it onto the system. Alternatively, you can upload the data manually on the simple and intuitive data entry page.
Acusera 24.7, while comprehensive and initially daunting due to its vast array of features, is incredibly easy to use. The Acusera 24.7 and QC operations teams are always eager to help new and existing Acusera 24.7 users with any issues they experience. We provide complete onboarding assistance and full training on the software for new customers while delivering prompt and effective customer support for existing users.
“The correspondence you get from Randox is first-rate.”
We’ve only begun to cover the range of features available on Acusera 24.7 for QC data management! For more information or to arrange a demo, get in touch with our team at [email protected]. Or, you can take a look at our website here.
“I’ve found working with Randox a productive partnership, both for me personally and for the company.”
MB Bureau